OLAP is a powerful tool that is widely used by the business community to analyze large financial data sets. Despite the big data sets found in modern biology, OLAP has not been widely adopted by the biology community. We want to change that. BIOLAP is open source OLAP for biology data. We take the open source tools provided by the JPivot project, and extend them to handle biology data types. In our first release, we focus on extensions to analyze large genomic sequence databases.
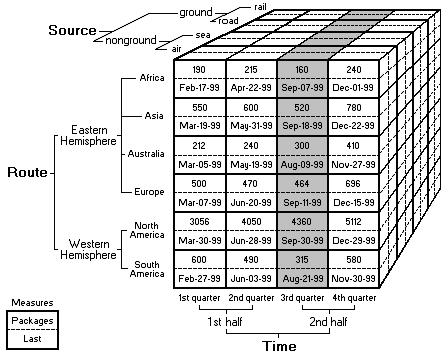
The basic idea is that data sets are viewed as cubes with hierarchies along each axis. To navigate the cube, we specify an aggregation function to say how to summarize information about groups of cells within the cube. This structure allows us to view large data sets in a highly summarized form, and then expand the data along each axis as needed to see finer grained features. More details can be found here.
In traditional OLAP, we are trying to summarize sets of numbers. In biology, the data we are working with is often non-numeric and the correct way to summarize that data may not be number. As a first example, suppose we are interested in summarizing a set of protein sequences. Usually these sequences are represented as strings of letters and there are several reasonable ways to summarize a group of sequences. We might want a numeric similarity score, we might want text output that shows the most common motifs shared by the sequences, we might even want a scatter plot or a tree diagram which shows how the sequences cluster together. This is just one example. Other common biology types are matrices for microarray data, graphs for chemical structures, or images from various kinds of instruments. For this reason, in order to handle biology data sets we have two main requirements:
Sounds hard? Not if you have the right tools!
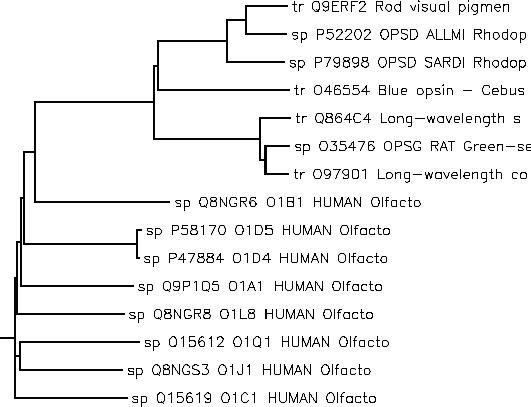
As an example, we start with a set of related olfactory and rhodopsin proteins grouped using a cladogram.
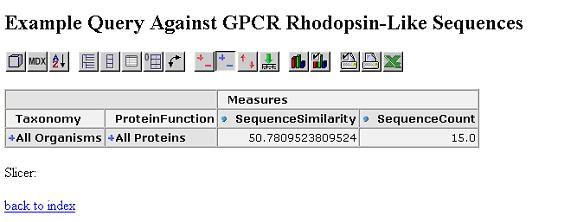
For each of these proteins, we have annotations describing their function and taxonomy. We use these annotations as dimensions for a cube and define an aggregation function (see the whitepaper for details) that measures sequence similarity. Here is what this gives us in JPivot:
We start by looking at the most aggregated view of the data, with all proteins grouped together.
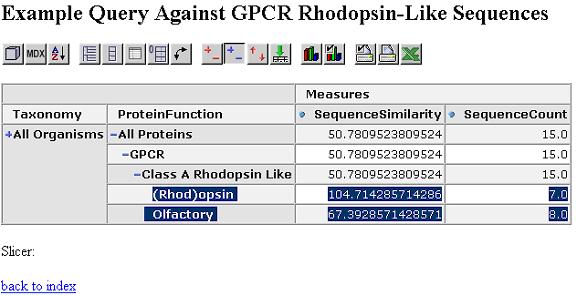
We can expand this by protein function dimension. Proteins within the same functional category have a higher similarity.
Expand by taxonomy dimension. Proteins within the same taxonomy class and functional category have an even higher similarity.
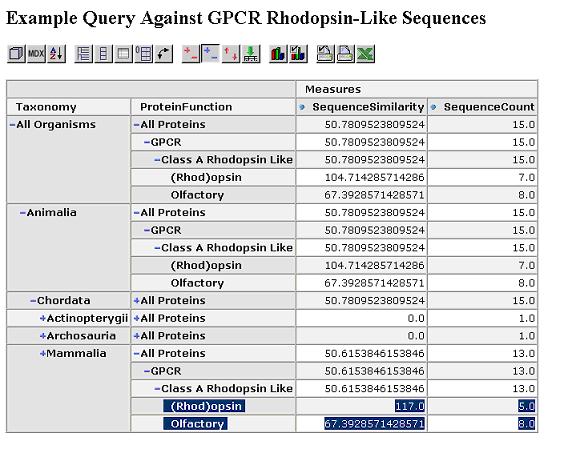
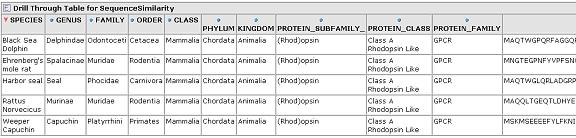
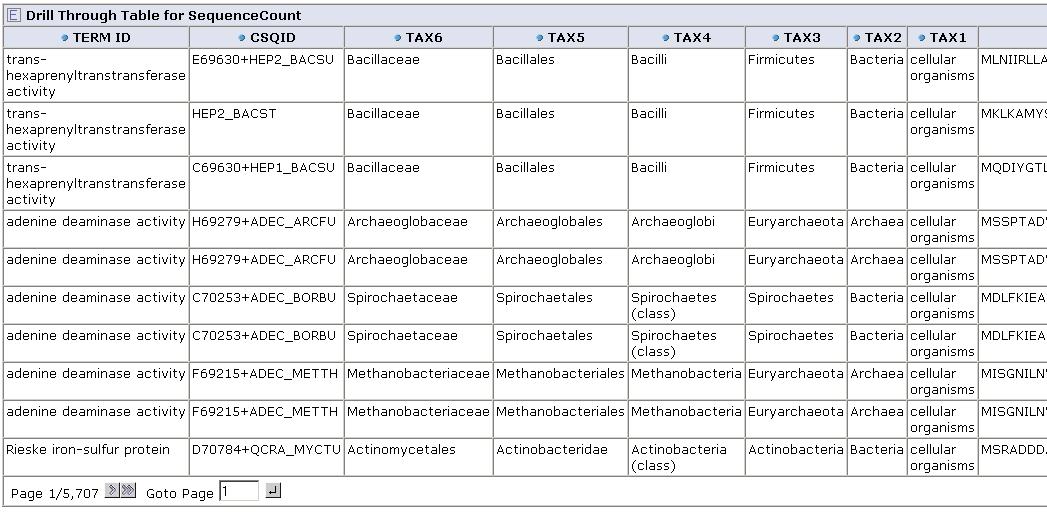
The similarity scores reflect what we would expect from the cladogram which was calculated via a full multiple sequence alignment. Drill through to see the underlying mammalian sequence data for any cell. In this case, we drill on the mammalian rhodopsin sequences.
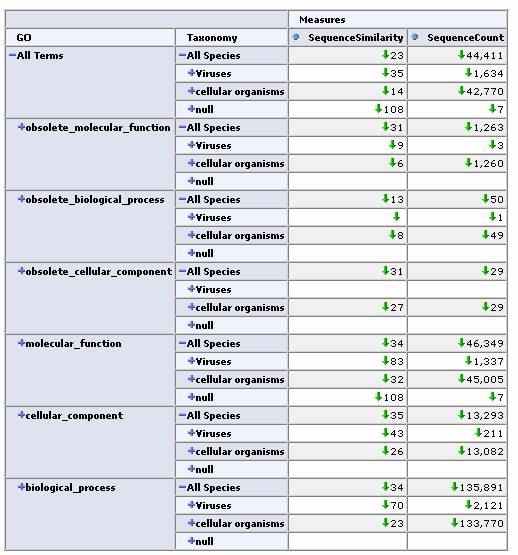
As a real-world test, we next applied this tool to the iProClass database. This database contains over 2 million protein sequences, annotated with GO classification, PIR superfamilies, motifs, protein domains etc. All of these annotations are potentially useful as dimensions for a cube. We chose two obvious ones, the GO protein function hierarchy and the taxonomy / lineage information for the sequence. By restricting our focus to sequences containing these annotations we came up with a total of 44,441 sequences for our cube. In this case, the initial similarity calculation for these 44k sequences took over 10 minutes. Fortunately, the OLAP browser allows us to pre-calculate similarities and store them in a table so that the response time of the viewer is near instantaneous. Again, an OLAP browser allows us to easily navigate this large data set.
Expand one level deep by GO classification and top level Taxonomy classification:
Expand by GO Hierarchy:
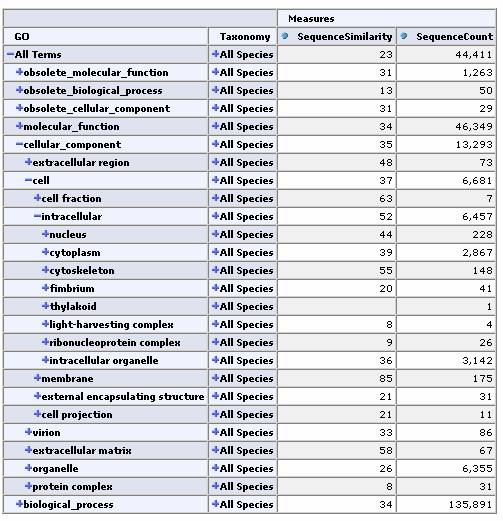
From any cell we can drill down to view the underlying data for that group of sequences:
Get feedback from you! Contact us on our forum with suggestions on what kinds of aggregation functions might be useful, or suggestions for applications.
Add more aggregation functions. One such function would be MEME to show conserved motifs in a set of protein sequences.
Either as text,
|
|||||||||||||||||||||||||||||||||||||||||||||||||||||||||||||||||||||||||||||||||||||||||||||||||||||||||||||||||||||||||||||||||||||||||||||||||||||||||||||||||||||||||||||||||
or as a block diagram,
or as LOGOS
output.

More biology examples. Extend the iProClass
example further or find other sequence databases where we can
pick off useful genomic annotations to use as dimensions for a
cube.
JPivot. The best place to start is with the basic JPivot tool. Download this tool along with the mondrian example data. Follow the directions to create an ODBC data connection called MondrianFoodMart. Deploy the the jpivot.war file to your tomcat webapps server directory.
BIOLAP Source Code + Examples.
Huyn N., OLAP
for Clinical Trials, Proceedings of the 27th
VLDB Conference, Roma, Italy, 2001.
Abstract: On-line analysis of clinical study
data has not benefited from recent advances in OLAP
technologies.We examine the analysis requirements posed by the
biotech domain that are not met by traditional OLAP. To
accommodate these new requirements, we propose the concept of
Scientific OLAP which applies more broadly to data analysis in
controlled scientific experiments. We describe our experience
implementing such a system for the support of biomarker discovery
and we identify some key challenges that must be overcome before
OLAP can be widely adopted in the biotech industry.
Vinga S., Almeida J., Alignment-free
sequence comparison-a review, Bioinformatics:2003 Mar
1;19(4):513-23.
Abstract: Genetic recombination and, in
particular, genetic shuffling are at odds with sequence
comparison by alignment, which assumes conservation of contiguity
between homologous segments. A variety of theoretical foundations
are being used to derive alignment-free methods that overcome
this limitation. The formulation of alternative metrics for
dissimilarity between sequences and their algorithmic
implementations are reviewed.
Kriegel H., Seidel T., Shape-based
Similarity Search in Large Biomolecular Databases.
Abstract: As a new approach to explore large
structural molecular databases, we suggest a shape-based
similarity model for 3D objects including proteins, DNA
structures, or medical images. On top of the model, we have
developed efficient index-based algorithms that support mining in
very large biological databases which are expected to rapidly
grow in the context of todays and tomorrows genomic, post-genomic
and proteomic research activities. Experiments on a large 3D
protein database demonstrate both, a good classification accuracy
of our model (above 90% like FSSP or CATH) and the good
performance of our flexible query processor.
Le S., Ho T., Phan T., A
Novel Graph-Based Similarity Measure for 2D Chemical Structures,
Genome Informatics 15(2): 82-91 (2004).
Abstract: In this paper, we propose a
graph-based method to measure the similarity between chemical
compounds described by 2D form. Our main idea is to measure the
similarity between two compounds based on edges, nodes, and
connectivity of their common subgraphs. We applied the proposed
similarity measure in combination with a clustering method to
more than eleven thousand compounds in the chemical compound
database KEGG/LIGAND and discovered that compound clusters with
highly similar structure compounds that share common names, take
part in the same pathways, and have the same requirement of
enzymes in reactions. Furthermore, we discovered the surprising
sameness between pathway modules identified by clusters of
similar structure compounds and that identified by genomic
contexts, namely, operon structures of enzyme genes.
MEME. A
system for motif discovery from a set of sequences.